Observability
popular
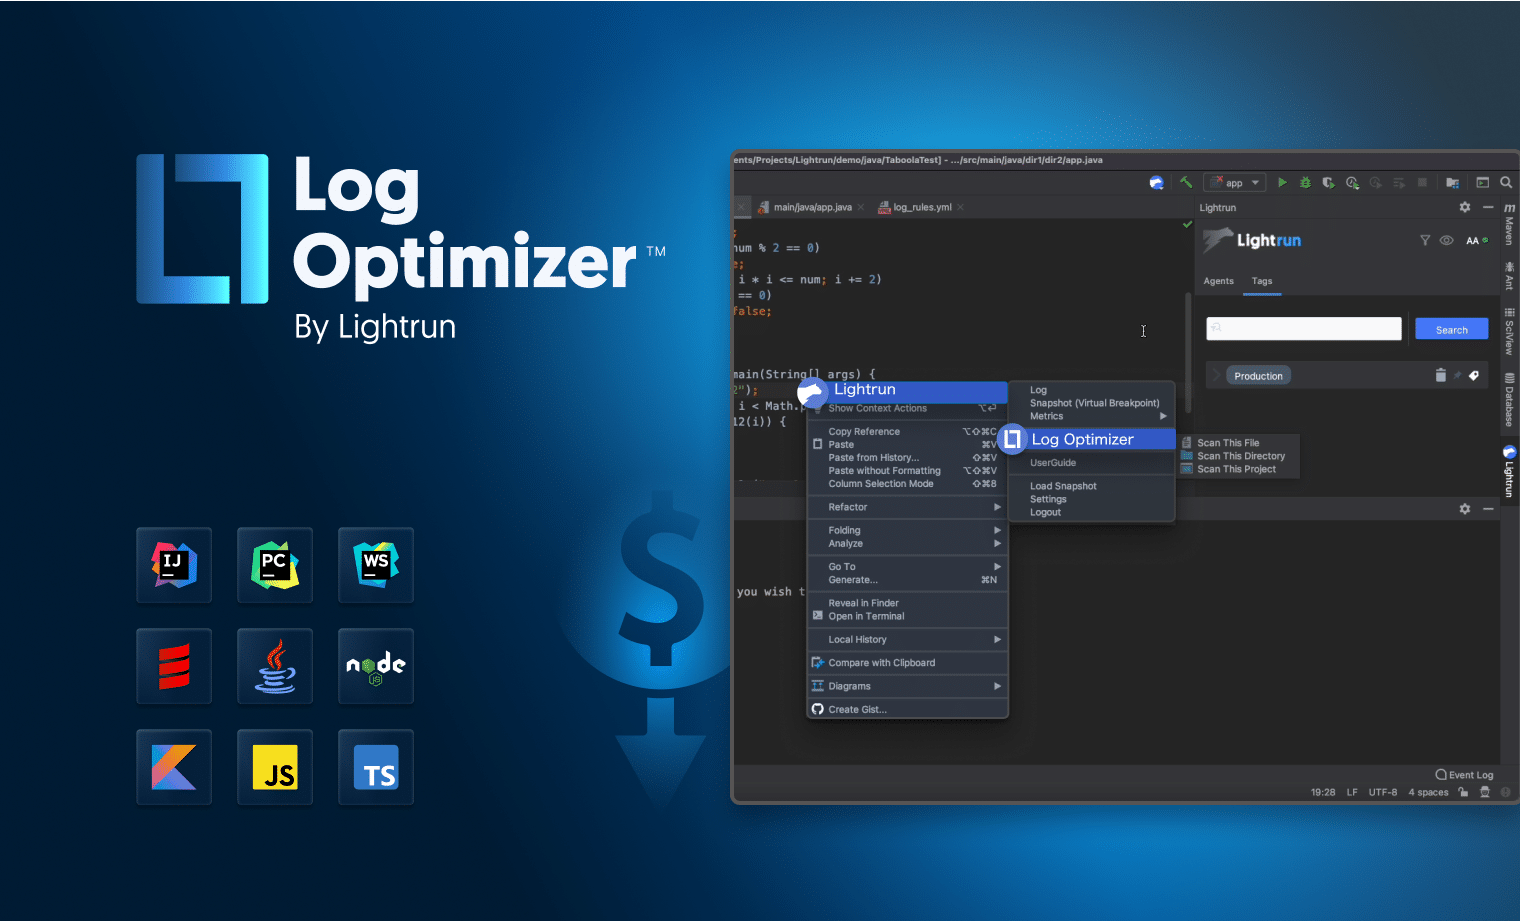
Reduce 60% of your Logging Volume, and Save 40% of your Logging Costs with Lightrun Log Optimizer
As organizations are adopting more of the FinOps foundation practices and trying to optimize their cloud-computing costs, engineering…
Lightrun Announces GA Support for Visual Studio Code
Lightrun gives developers using VS Code granular, code-level visibility into live applications directly from the IDE, without having…
Lightrun Releases KoolKits – Debugging Toolkits for Kubernetes
KoolKits (Kubernetes toolkits) are highly-opinionated, language-specific, batteries-included debug container images for Kubernetes. In practice, they're what you would've…
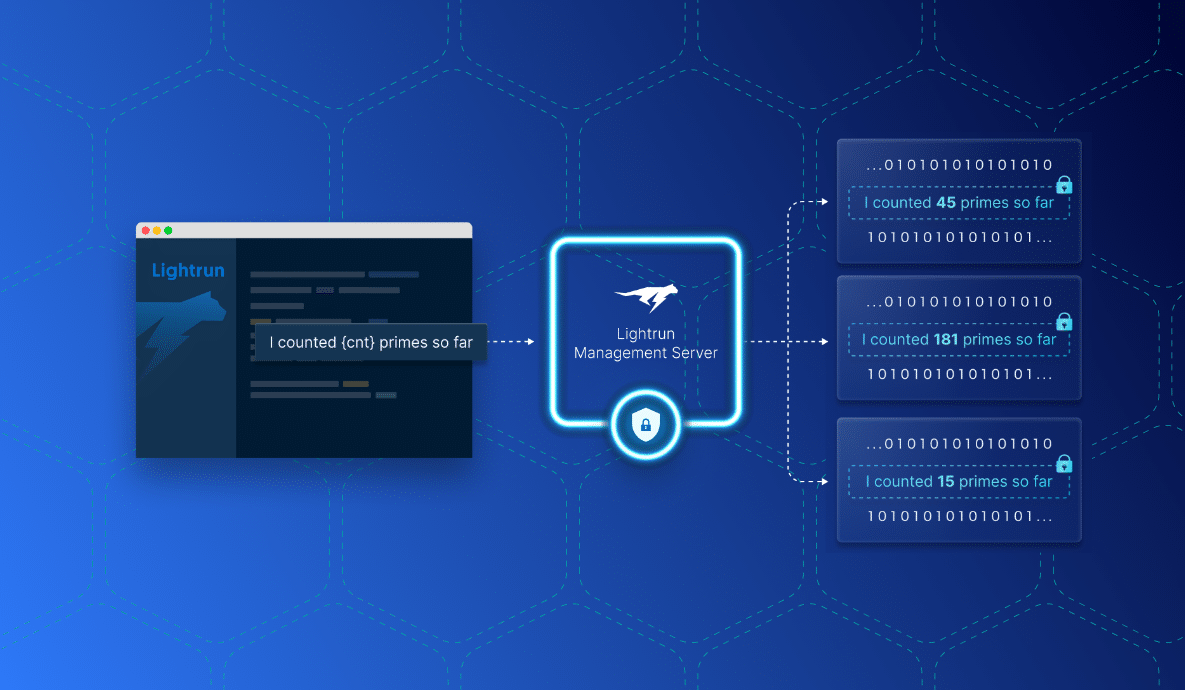
Why You Should Consider Dynamic Repurposing Instrumentation
As a developer, how much time do you actually spend writing code? According to this survey by The…
Full-cycle observability with the Elastic Stack and Lightrun
Developers can use a combination of a robust observability stack to collect, transform and view logs application-wide, paired with a real-time observability platform that can augment the log stream without pushing new code, re-deploying, or even restarting the service. That’s how Elastic and Lightrun can tame that beast together.
Full-Cycle Observability With Instana and Lightrun
Developers can use a combination of a robust observability stack to collect, transform and view logs application-wide, paired with a real-time observability platform that can augment the log stream without pushing new code, re-deploying, or even restarting the service. That’s how Elastic and Lightrun can tame that beast together.
Interview with Tom Granot – Developer Observability, KoolKits and Reliability
In preparation for the upcoming Developer Observability Masterclass we’re hosting at Lightrun with Thoughtworks, RedMonk and JFrog, I…